Gauges
A gauge is a visual display of a value. A gauge can be editable (an interactive gauge) or not editable (a noninteractive gauge). A typical use for an interactive gauge is enabling the user to set a volume level; a typical use for a noninteractive gauge is to give the user feedback on the app's progress through a long task. Screenshot shows an interactive gauge on a mobile phone.
Screenshot Gauge on a Mobile Phone

There are three types of noninteractive gauges: a progress bar, an incremental gauge, and a continuous gauge. A typical use of a progress bar is to show the user the device's progress through a file transfer when the file's size is known. It can show how far the task is from completing. A typical use of an incremental gauge is to show the user the device's progress through a file transfer when the file's size is not known. The device can tell it is receiving data, so the gauge can provide feedback to indicate that the task is progressing, but it cannot tell the user how far it is from the end of the task. A typical use of a continuous gauge is to let the user know the device is using the network to request information. The device cannot tell whether the server is making progress toward getting the requested information, nor can it tell when the requested information will arrive. It merely provides feedback that the app is still running and the device is not broken.
|
app Developer Responsibilities |
MIDP Implementor Responsibilities |
|---|---|
|
|
MIDP Implementors
Recommend:
Create different visual appearances for the different types of gauges so that users can easily see the purpose of the gauge. For example, they should be able to tell whether they can use a gauge to change a setting or only get to information from it. If they can only get information from it, they should also be able to tell which type of information it is imparting.
Interactive Gauges
An interactive gauge enables the user to set a value. For example, an app could use an interactive gauge to enable the user to enter a value that controls the pace of a game. An interactive gauge has a range of values from zero to an app-defined maximum value.
app Developers
Strongly Recommend:
Set a small maximum value in a gauge (at most, provide a range of a few dozen values). If the value is for an API that expects a broader range of values, map the gauge value onto the broader range.
For example, consider an API that controls a volume level by accepting a parameter expressed as a percentage (0 to 100) of maximum. Most devices don't have 100 distinct volume levels. It would be reasonable to use a gauge to represent a smaller range that is then mapped onto the 0 to 100 range expected by the API. To do this, the app would create a gauge with a maximum value of, for example, 20. It would then map this into the 0 to 100 range by computing (gauge-value * 5). There are two reasons to keep the range of values small. First, it will help to keep the range of values closer to the number of distinct visual states possible on most devices. The closer these values are, the fewer values share the same visual representation. This will make your gauge appear to be more responsive. Second, it will improve app usability. In many cases, the only means for the user to modify the value of an interactive gauge will be to press a button to increase or decrease the gauge's value by one. Keeping the range of values relatively small means that the user will probably have less work to do to change the value of the gauge.
MIDP Implementors
Consider: Use a visual representation for interactive gauges that distinguishes the smaller values from the larger values. For example, Screenshot shows a gauge that has shorter bars on the left, representing smaller values, and longer bars on the right, representing higher values.
Screenshot Interactive Gauge
Recommend:
Strongly Recommend:
Strongly Recommend:
Consider: Use a different visual state, instead of reverse video, to show that an interactive gauge has focus. Using reverse video to show that a gauge has focus can be confusing. Screenshot shows an alternative to using reverse video for highlighting. It draws the unfilled bars with black lines when the gauge has focus and gray lines when it does not. (On black-and-white displays, it uses solid versus dotted lines.)
Screenshot Interactive Gauge with and without User Focus


Progress Gauges
A progress gauge is a noninteractive gauge with a definite range. The app must supply a maximum value. The device maps the value of the gauge onto the display so that the user can see how close the current value is to the maximum value. Screenshot shows a progress bar.
Screenshot Progress Bar

The recommendations for progress bars are similar to the recommendations for interactive gauges. The difference is that MIDP implementors do not give users a way to change the value of a progress bar. Instead, the MIDP implementation updates the display of the progress bar as the app changes the gauge value.
Incremental Gauges
An app should use an incremental gauge when it can detect that it is making progress but does not know when the task will end. For example, if your app is receiving an unknown amount of pushed data, you can provide feedback that data is coming in, but not on how much longer it will be until the data transfer is done. In this case, an incremental gauge is appropriate. Incremental gauges do not have a defined range, so the app supplies the constant INDEFINITE as its maximum value.
app Developers
Strongly Recommend:
INCREMENTAL_UPDATING and INCREMENTAL_IDLE are the two states of an incremental gauge. The MIDP Reference Implementation uses the images shown in Screenshot for these states.
Screenshot Incremental-Running and Incremental-Idle Gauges

Continuing with the example of receiving pushed data while the app receives data, you should use the incremental gauge's INCREMENTAL_UPDATING state. You would then update the gauge after each time your app receives a certain amount of data. You should change to the incremental-idle state when you have finished receiving the message and are closing connections, or preparing the message for display to the user.
Strongly Recommend:
Like a progress bar, the state of an incremental gauge changes in response to the app. Unlike a progress bar, however, the incremental gauge will not supply a value in a definite range. Instead, the app merely indicates that progress has been made.
MIDP Implementors
Strongly Recommend:
Strongly Recommend:
Continuous Gauges
An app should use a continuous gauge when it cannot detect that it is making progress but needs to let the user know that the app is running and the device is not broken. For example, the MIDP Reference Implementation uses a continuous gauge when the user installs a MIDlet suite. When the installer contacts the server to download the JAR or JAD file, there is no way to know whether the server is making progress toward sending the requested file or how long the interaction will take. Continuous gauges do not have a defined range, so the app supplies the constant INDEFINITE as its maximum value.
app Developers
Strongly Recommend:
Consider: The danger in using a continuous-running gauge is that the app will never return and turn it off. This could happen if the operation never completes or your MIDlet crashes.
CONTINUOUS_RUNNING and CONTINUOUS_IDLE are the two states of a continuous gauge. The MIDP Reference Implementation uses the images shown in Screenshot for these states.
Screenshot Continuous-Running and Continuous-Idle Gauges
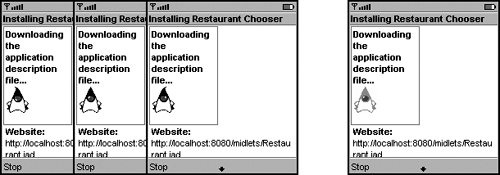
Continuing with the example of getting a MIDlet suite's JAR or JAD file, while the installer contacts the server and waits for a reply, it uses the continuous gauge's CONTINUOUS_RUNNING state. After the file is downloaded, the installer uses the continuous gauge's CONTINUOUS_IDLE state while finishing the installation.
Strongly Recommend:
MIDP Implementors
Strongly Recommend:
For example, in Screenshot, notice that Duke is waving his head for the CONTINUOUS_RUNNING state. The animation shows that activity is occurring, but it doesn't imply any particular progress toward the goal. The figure also shows Duke in the CONTINUOUS_IDLE state.
Strongly Recommend:
Improving User Feedback From Noninteractive Gauges
Any time an app uses a noninteractive gauge, it should provide additional information to help the user understand the activity the gauge is tracking. If the activity is interruptible, the user should have the opportunity to stop it.
app Developers
Recommend:
Screenshot Additional Information on the Form with a Gauge
Strongly Recommend:
