Monitoring System Performance
Monitoring System Performance
A key systems-administration task is to keep track of how well your CentOS Linux system performs. You can monitor the overall performance of your Linux system by gathering information such as:
-
Central Processing Unit (CPU) usage
-
Physical memory usage
-
Virtual memory (swap space) usage
-
Hard disk usage
CentOS Linux comes with a number of utilities you can use to monitor one or more of these performance parameters. The following sections introduce you to a few of these utilities and show you how to understand the information they present.
Using top
To view the top CPU processes-the ones that use most of the CPU time-you can employ the top program. To start this program, type top in a terminal window (or text console). The top program then displays a text screen listing the current processes, arranged in the order of CPU usage, along with other information, such as memory and swap-space usage. Figure 20-3 shows typical output from the top program.

The top utility updates the display every 5 seconds. You can keep top running in a window so that you can continually monitor the status of your Linux system. You quit top by pressing q or Ctrl-C or by closing the terminal window.
The first six lines of the output screen provide summary information about the system. Here is what these six lines show:
-
The first line shows the current time, how long the system has been up, how many users are logged in, and three load averages (the average number of processes ready to run during the last 1, 5, and 15 minutes).
-
The second line lists the total number of processes and the status of these processes.
-
The third line shows CPU usage-what percentage of CPU time user processes employ, what percentage of CPU time system (kernel) processes employ, and what percentage of time the CPU is idle.
-
The fourth and fifth lines show how the physical memory is used-the total amount, how much is used, how much is free, how much is shared, and how much is allocated to buffers (for reading from disk, for instance).
-
The sixth line shows how the virtual memory (or swap space) is used-the total amount of swap space, how much is used, how much is free, and how much is cached.
The following table the summary data lists information about the current processes arranged in decreasing order of CPU time usage. Table 20-9 summarizes the meanings of the column headings in the table that top displays.
|
Heading |
Meaning |
|---|---|
|
|
The process ID of the process |
|
|
Username under which the process runs |
|
|
Priority of the process-the value ranges from |
|
|
Nice value of the process (same as negative PRI values) |
|
|
Total size of the process in kilobytes |
|
|
Total physical memory used by task (typically shown in kilobytes, but an |
|
|
Amount of shared memory the process uses |
|
|
State of the process ( |
|
|
Percentage of CPU time used since last screen update |
|
|
Percentage of physical memory the process uses |
|
|
Total CPU time the process has used since it started |
|
|
Shortened form of the command that starts the process |
| Insider Insight |
If the RSS field is drastically smaller than the SIZE field for a process, the process is using too little physical memory compared with what it needs. The result is a lot of swapping as the process runs. You can use the vmstat utility (which you try later in this chapter) to find out how much your system is swapping. |
Using the GNOME System Monitor
Like the text-mode top utility, the GNOME System Monitor tool also enables you to view the system load in terms of the number of processes currently running, their memory usage, and the free disk space on your system. To run this tool, select Main Menu>System Tools>System Monitor. The System Monitor starts and displays its output in a window (Figure 20-4).
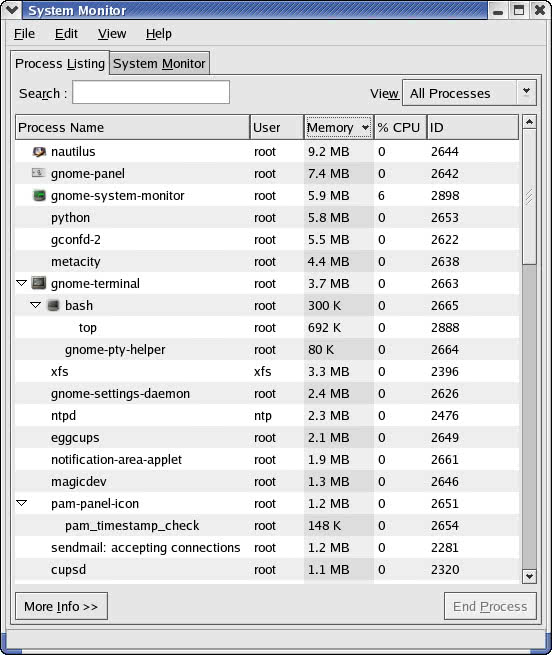
The output is similar to the output you see when you type top in a text-mode console or terminal window. In fact, the column headings in the table match what the top utility uses in its output. (See Table 20-9 for the meaning of the column headings.) As with the text-mode top utility, the display is continuously updated to reflect the current state of the system.
You can click the columns to sort the processes in different ways. You can use the drop-down list on the upper-right corner of the window to select which processes you want to see. Figure 20-4 shows a list of processes sorted in descending order of their memory usage. For each process, the GNOME System Monitor shows a number of details including the process ID (PID), the user who starts the process, and the command used to start the process.
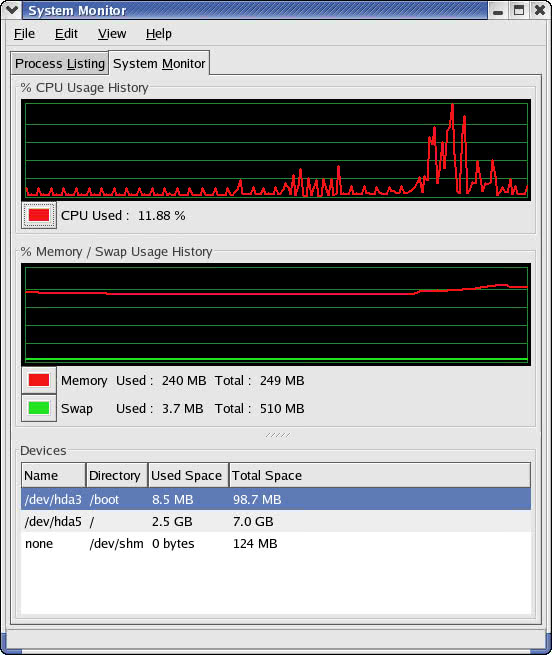
The GNOME System Monitor window has another tab that displays the CPU and memory usage history and the free space on the file system. To view this information, click the System Monitor tab. Figure 20-5 shows the typical graphical output in the System Monitor tab. You will find the plots easy to understand. At the bottom of the tab, you see the amount of free and used space on the file systems.
Using the vmstat Utility
You can get summary information about the overall system usage with the vmstat utility. To view system-usage information averaged over 5-second intervals, type the following command (the second argument indicates the total number of lines of output vmstat should display):
vmstat 5 8
   procs                      memory    swap          io     system         cpu
 r  b  w   swpd   free   buff  cache  si  so    bi    bo   in    cs  us  sy  id
 1  0  0  46100   5304   2740  12572   0   0     2     5   11     9  10   5   7
 0  0  0  46100   5304   2748  12572   0   0     0     6  104    69   3   5  92
 0  0  0  46100   5304   2756  12572   0   0     0     5  103    71   4   6  91
 1  0  0  46100   5304   2764  12572   0   0     0     3  104    62   3   6  91
 1  0  0  46100   5304   2772  12572   0   0     0     3  103    63   2   4  94
 0  0  0  46100   5304   2780  12572   0   0     0     3  104    69   2   7  91
 0  0  0  46100   5300   2788  12572   0   0     0     3  103    64   2   7  91
 1  0  0  46100   5292   2796  12572   0   0     0     6  104    66   2   3  94
The tabular output is grouped into six categories of information, as the fields in the first line of output indicate. The second line shows further details for each of the six major fields. You can interpret the six major fields, as well as the detailed fields in each category, using Table 20-10.
|
Field Name |
Description |
|---|---|
|
|
Number of processes and their types: |
|
|
Information about physical memory and swap space usage (all numbers in kilobytes): |
|
|
Amount of swapping (the numbers are in kilobytes per second): |
|
|
Information about input and output (the numbers are in blocks per second; the block size depends on the disk device): |
|
|
Information about the system: |
|
|
Percentages of CPU time used: |
The first line of vmstat output following the two header lines shows the averages since the last reboot. After that, vmstat displays the 5-second average data seven more times over the next 35 seconds. In the vmstat utility's output, high values in the si and so fields indicate too much swapping. High numbers in the bi and bo fields indicate too much disk activity.
Checking Disk Performance and Disk Usage
CentOS Linux comes with the /sbin/hdparm program, which you can use to control IDE or ATAPI hard disks common on most PCs. One feature of the hdparm program is that the -t option enables you to determine the rate at which data can be read from the disk into a buffer in memory. For example, here's the result of the command on my system:
/sbin/hdparm -t /dev/hda
/dev/hda:
 Timing buffered disk reads:  64 MB in 3.05 seconds =  21.00 MB/sec
As you can see, the command requires the IDE drive's device name (/dev/hda) as an argument. If you have an IDE hard disk, you can try this command to see how fast data can be read from your system's disk drive.
To display the space available in the currently mounted file systems, use the df command. If you want a more human-readable output from df, type the following command:
df -h
Filesystem            Size  Used Avail Use% Mounted on
/dev/hda5             7.1G  2.6G  4.2G  38% /
/dev/hda3              99M  8.6M   86M  10% /boot
none                  125M     0  125M   0% /dev/shm
As this example shows, the -h option causes the df command to show the sizes in gigabytes (G) and megabytes (M).
To check the disk space a specific directory uses, employ the du command. You can specify the -h option to view the output in kilobytes (k) and megabytes (M), as shown in the following example:
du -h /var/log
4.0K    /var/log/vbox
20M     /var/log/cups
4.0K    /var/log/samba
4.0K    /var/log/news/OLD
8.0K    /var/log/news
12K     /var/log/httpd
4.0K    /var/log/squid
532K    /var/log/gdm
23M     /var/log
The du command displays the disk space each directory uses, and the last line shows the total disk space that directory uses. If you want to see only the total space a directory uses, use the -s option, like this:
du -sh /var
71M     /var
This says that the /var directory uses 71M of disk space.
Exploring the /proc File System
You can find out a great deal about your Linux system by consulting the contents of a special file system known as /proc. Knowing about the /proc file system is useful because it can help you monitor a wide variety of information about your system. In fact, you can even change kernel parameters through the /proc file system and thereby modify the system's behavior.
The /proc file system is not a real directory on the disk but a collection of data structures in memory, managed by the Linux kernel, that appears to the user as a set of directories and files. The purpose of /proc (also called the process file system) is to enable users to access information about the Linux kernel and the processes currently running on your system.
You can access the /proc file system just as you access any other directory, but you have to know the meaning of various files to interpret the information. Typically, you can use the cat or more command to view the contents of a file in /proc; the file's contents provide information about some aspect of the system.
As with any directory, you may want to start by looking at a detailed directory listing of /proc. To do so, type ls -l /proc. In the output, the first set of directories (indicated by the letter d at the beginning of the line) represents the processes currently running on your system. Each directory that corresponds to a process has the process ID (a number) as its name.
| Insider Insight |
Also notice a very large file named /proc/kcore; that file represents the entire physical memory of your system. Although /proc/kcore appears in the listing as a huge file, there is no physical file occupying that much space on your hard disk. You should not try to remove this file to reclaim disk space. |
Several files and directories in /proc contain interesting information about your Linux system. The /proc/cpuinfo file, for example, lists the key characteristics of your system, such as processor type and floating-point processor information. You can view the processor information by typing cat /proc/cpuinfo. For example, here is what I get when I type the command on my system:
cat /proc/cpuinfo
processor       : 0
vendor_id       : GenuineIntel
cpu family      : 15
model           : 2
model name      : Mobile Intel(R) Celeron(R) CPU 1.50GHz
stepping        : 7
cpu MHz         : 1495.631
cache size      : 256 KB
fdiv_bug        : no
hlt_bug         : no
f00f_bug        : no
coma_bug        : no
fpu             : yes
fpu_exception   : yes
cpuid level     : 2
wp              : yes
flags           : fpu vme de pse tsc msr pae mce cx8 sep mtrr pge mca cmov pat pse36 clflush dts acpi mmx fxsr sse sse2 ss ht tm
bogomips        : 2981.88
This output is from a 1.4GHz Intel Celeron system. The listing shows many interesting characteristics of the processor. Notice the line that starts with fdiv_bug. Remember the infamous Pentium floating-point-division bug? The bug is in an instruction called fdiv (for floating-point division). Thus, the fdiv_bug line indicates whether or not this particular Pentium has the bug (fortunately, my system's processor does not).
Table 20-11 summarizes some of the files in the /proc file system from which you can get information about your Linux system. You can view some of these files on your system to see what they contain. Note that not all the files shown in Table 20-11 are present on your system-the contents of the /proc file system depend on the kernel configuration and the driver modules loaded (which, in turn, depend on your PC's hardware configuration).
| Insider Insight |
You can navigate the /proc file system just as you work with any other directories and files in Linux. Use the more or cat command to view the contents of a file. |
|
File Name |
Content |
|---|---|
|
|
Information about Advanced Power Management (APM) |
|
|
Directory with bus-specific information for each bus type, such as PCI |
|
|
The command line used to start the Linux kernel (for example, |
|
|
Information about the CPU (the microprocessor) |
|
|
Available block and character devices in your system |
|
|
Information about DMA (direct memory access) channels that are used |
|
|
Directory with information about various drivers (for example, you will find information about the |
|
|
Information about any frame buffer devices |
|
|
List of supported file systems |
|
|
Directory with file-system parameters |
|
|
Directory containing information about IDE devices |
|
|
Information about interrupt request (IRQ) numbers, how they are used, and how many interrupts were generated for each IRQ |
|
|
Memory map showing how various ranges of physical memory addresses are being used |
|
|
Information about input/output (I/O) port addresses and how they are used |
|
|
Directory that contains subdirectories for each interrupt request (IRQ) number, with the |
|
|
Image of the physical memory |
|
|
Kernel messages |
|
|
Kernel symbol table |
|
|
Load average (average number of processes waiting to run in the last 1, 5, and 15 minutes) |
|
|
Current kernel locks (used to ensure that multiple processes do not write to a file at the same time) |
|
|
Information about physical memory and swap-space usage |
|
|
Miscellaneous information |
|
|
List of loaded driver modules |
|
|
List of mounted file systems |
|
|
Directory with many subdirectories that contain information about networking |
|
|
List of partitions known to the Linux kernel |
|
|
Information about PCI devices found on the system |
|
|
Directory with information about SCSI devices, if any, found on the system |
|
|
Information about the sound driver module, if any |
|
|
Overall statistics about the system |
|
|
Information about the swap space and how much is used |
|
|
Directory with information about the system (You can change kernel parameters by writing to files in this directory. This is one way to tune the system's performance, but it requires expertise to do it properly.) |
|
|
Information about System V interprocess communication (IPC) resources such as shared memory |
|
|
Information about tty drivers |
|
|
Information about how long the system has been up |
|
|
Kernel version number |
Using sysctl to View and Set Kernel Parameters
As the entry for /proc/sys in Table 20-11 explains, you can change kernel parameters by writing to files in the /proc/sys directory. This is one way to tune the system's performance. CentOS Linux also comes with the /sbin/sysctl program that enables you to read and write kernel parameters without having to overwrite files manually in the /proc/sys directory.
In Chapter 13, you encounter an instruction that asks you to log in as root and enable IP forwarding in the kernel by typing the following command:
echo "1" > /proc/sys/net/ipv4/ip_forward
This is the manual way to set the value of a parameter-using the echo command to copy the value into a file in the /proc/sys directory.
You can perform this same step by running sysctl as follows:
/sbin/sysctl -w net.ipv4.ip_forward=1
net.ipv4.ip_forward = 1
This sysctl command sets the value of the parameter and echoes the new value for your information. As you can see, you refer to the parameter by using the last part of the pathname excluding /proc/sys, but you use periods (.) instead of slashes (/) as separators. Note that, if you prefer, you can continue to use slashes as separators and can refer to this variable as net/ipv4/ip_forward.
You can use sysctl to both query and set the value of a parameter. To see the value of a parameter, use the parameter's name as an argument like this:
/sbin/sysctl dev.cdrom.info
The command /sbin/sysctl dev.cdrom.info displays the contents of that parameter. In this case, dev.cdrom.info is a structure that contains many different fields; sysctl shows these fields as separate lines in the output.
For a simple parameter, such as fs.file-max, sysctl displays the single value as shown in the following example:
/sbin/sysctl fs.file-max
fs.file-max = 26163
The fs.file-max variable denotes the maximum number of file handles the Linux kernel can allocate. If you get error messages about running out of file handles, you may want to increase this value with a command, such as /sbin/sysctl -w fs.file-max=65535.
If you have a number of parameters to alter using sysctl, you can place the parameters and their values in a file and use the command /sbin/sysctl -p filename to load the settings from that file. For example, when CentOS Linux boots, a startup script sets some parameters with the following command:
/sbin/sysctl -p /etc/sysctl.conf
On my CentOS Linux system, the /etc/sysctl.conf file contains the following lines:
# Disables packet forwarding
net.ipv4.ip_forward = 0
# Enables source route verification
net.ipv4.conf.all.rp_filter = 1
# Disables automatic defragmentation (needed for masquerading)
net.ipv4.ip_always_defrag = 0
# Disables the magic-sysrq key
kernel.sysrq = 0
# Appends the PID to the core filename during core dumps
kernel.core_uses_pid = 1
Table 20-12 describes some of the interesting kernel parameters from the /proc/sys directory, as well as the meaning of these parameters.
|
Parameter Name |
Meaning |
|---|---|
|
|
Maximum number of file handles the Linux kernel can allocate |
|
|
Three values representing the number of allocated file handles, the number of used file handles, and the maximum number of file handles |
|
|
Maximum number of superblocks, and thus the maximum number of mounted file systems the kernel can support (default value is 256) |
|
|
Three values specifying high, low, and frequency that control the logging of process accounting information-when free space on file system goes below the low (percent), accounting is suspended; it resumes when free space goes above high (percent), and frequency specifies how many seconds the free space information is valid (default values are |
|
|
When set to |
|
|
The NIS domain name of the system |
|
|
The hostname of the system |
|
|
Name of the program that the kernel uses to load one or more modules (for example, |
|
|
The version number of the operating system (for example, |
|
|
Name of operating system (for example, Linux for all Linux systems) |
|
|
Number of seconds the kernel waits before rebooting in case of a panic (default is |
|
|
Values that affect the printing or logging of error messages by the kernel |
|
|
Maximum number of POSIX real-time signals that can be outstanding in the system (default is |
|
|
Number of real-time signals currently queued |
|
|
Total amount, in bytes, of shared memory segments that can be created (default is |
|
|
Maximum size, in bytes, of shared memory segments that can be created (default is |
|
|
When set to 0, the SysRq key is disabled; when set to 1, user can perform specific tasks by pressing Alt-SysRq and a command key (see the file |
|
|
The build number and the date the kernel was built (for example, |
|
|
Maximum number of packets that can be queued on input when a network interface receives packets faster than the kernel can process them (default is |
|
|
Maximum size of ancillary buffer allowed per socket (default is |
|
|
Default size of socket receive buffer in bytes (default is |
|
|
Maximum size of socket receive buffer in bytes (default is |
|
|
Default size of socket send buffer in bytes (default is |
|
|
Maximum size of socket send buffer in bytes (default is |
|
|
When set to |
|
|
When set to 1, accepts source routed packets (should be set to |
|
|
When set to |
|
|
When set to |
|
|
When set to |
|
|
When set to |
|
|
When set to |
|
|
When set to |
|
|
When set to |
|
|
When set to |
|
|
When set to |
|
|
When set to |
|
|
When set to |
|
|
When set to |
|
|
When set to |
|
|
When set to |
|
|
When set to |
|
|
Contains |
|
|
Time-to-live (TTL) for IP packets (default value is |
|
|
When set to |
|
|
Two numbers denoting the range of port numbers used by TCP and UDP for the local port (default range |
|
|
When set to |
|
|
Maximum memory for use in reassembling IP fragments (default is |
|
|
When maximum amount of memory ( |
|
|
Time in seconds to keep an IP fragment in memory (default is 30 seconds) |
|
|
Number of seconds to wait for a final FIN before the socket is closed-this occurs to prevent denial-of-service attacks (default is 180 seconds) |
|
|
Number of keepalive probes TCP sends out before it decides that the connection is broken (default value is |
|
|
Time in seconds between keepalive messages (default is |
|
|
Maximum number of keepalive probes to send in one interval of the slow timer (default is |
|
|
Length of the backlog queue for each socket (default is |
|
|
Number of times an answer to a TCP connection request is retransmitted before giving up (default is |
|
|
Number of times a TCP packet is retransmitted before giving up (default is |
|
|
When set to 1, enables select acknowledgments as specified in RFC 2018 |
|
|
Number of times initial SYNs for a TCP connection attempt are retransmitted (default value is |
|
|
When set to |
|
|
When set to |
|
|
When set to |
|
|
Settings that control the operation of the |
|
|
The first value denotes the minimum percentage of memory that should be used for the buffers (default is |
|
|
Three values provide minimum, low, and high threshold values for the number of free pages that control swapping-when the number of free pages reaches the minimum, only the kernel can allocate more memory; if the number of free pages drops below the low threshold, kernel starts swapping aggressively; the high threshold is the number of pages the kernel tries to keep available (the default values are |
|
|
The three values specify base, minimum, and cluster values that control the operation of |
|
|
If this value is set to |
|
|
Similar to |
|
|
If this value is |
|
|
The range of values that specify the size of the cache for page tables-primarily used for multiprocessor systems (default is between 25 and 50) |