
|
|
| Note |
All benchmarks on the following test were run on a 1 Ghz Pentium III with 512 MB of RAM under Windows XP. Microsoft Web app Stress Tool, app server and database were running in the same machine. The software versions were JBoss 3.0.0, Oracle 8.1.7, and JavaJDK 1.3.1_02. Logging was switched to production level (errors and warnings only). |
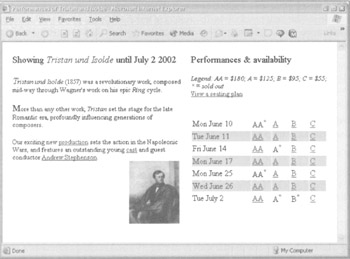
Let's now look at a case study of addressing the performance requirements of one use case in the sample app. Let's consider requests for the "Display Show" page. This displays information about all tutorialable performances of a particular show. The "Welcome" page links directly to this page, so most users will arrive here on their second page view, although they may be interested in different shows. Thus it's vital that this page can cope with heavy user activity, that it renders quickly and that generating it doesn't load the system too heavily. Some of the information displayed on this page is rarely changing reference data: for example, the name of the show and the pricing structure. Other information changes frequently: for example, we must display the availability of each seat type for every performance (with 10 performances of a show displayed and 4 classes of seats for each, this would mean 40 availability checks). Business requirements state that caching may be acceptable if required to deliver adequate performance, but that the availability information must be no more than 30 seconds old. The following screenshot illustrates this page:
We begin by running load tests without any caching or other optimizations in app code to see whether there is a problem. The Microsoft Web app Stress Tool reveals that with 100 concurrent users, this page can take 14 hits per second, with an average response time of just over 6 seconds. The load test showed JBoss using 80% of CPU and Oracle almost 20% (it's important to use your operating system's load monitoring tools during load testing). Although this exceeds our modest performance targets for concurrent access, it does not meet requirements for response time. Throughput and performance could deteriorate sharply if we had to display more than 3 performances of a show (our test data), or if Oracle was on a remote server, as would be the case in production. Of course we would test the effect of these scenarios in a real app, but I have limited hardware and time at my disposal while writing this tutorial. Thus we must implement design and code changes necessary to improve the performance of generating this page. It's pretty clear from the Task Manager display that the problem is largely in communication with, and work within, the database. However, before we begin amending our design and changing code, it's a good idea to get some precise metrics of where the app spends its time. So we profile two requests for this page in JProbe. The results, ordered by cumulative method time, look as follows:

These results indicate that we have executed 6 SQL queries per page view, shown by the 12 invocations of the SqlQuery.execute() method, and that these queries accounted for 52% of the total time. Rendering the JSP accounted for a surprisingly high 26% of execution time. However, it's clear that the database access is the main limiter on performance. The 13% spent reflectively invoking methods using reflection via Method.invoke() indicates the 12 EJB accesses per page view. BothJBoss and the EJB proxy infrastructure discussed in use reflection in EJB invocation. 12 EJB invocations per page is also unacceptably high, due to the overhead of invoking EJB methods, so we will also want to address this. As the queries involved are simple selects and don't involve transaction or locking issues, we can rule out locking in the database or within the app server (we should also check that the database is correctly configured and the schema efficient; we'll assume this to be the case). Since we can't make simple selects more efficient, we'll need to implement caching in business objects to minimize the number of calls to the database. As business requirements allow the data presented on this screen to be as much as 30 seconds out of date, we have room for maneuvering. Since the web-tier code in com.wrox.expertj2ee.ticket.web.TicketController is coded to use the com.wrox.expertj2ee.ticket.command.AvailabilityCheck interface to retrieve availability imformation,rather than a concrete implementation, we can easily substitute a different JavaBean implementation to implement caching.
| Important |
Interface-driven design is an area in which good design practice leads to maximum freedom in performance tuning. While there is a tiny overhead in invoking methods through an interface, rather than on a class, it is irrelevant in comparison with the benefits of being able to reimplement an interface without affecting callers. |
| Note |
During high-level design, we also considered the possibility of usingJMS to fire updates on reservations and purchases, as an alternative to caching, to cause data to be invalidated only when it's known to be changed. As reservations can timeout in the database, without further activity through the web tier, this would be moderately complex to implement: we'd have to schedule a secondJMS message to be sent on the reservation's expiry, so that any cache could check whether the reservation expired or had been converted into a purchase. Further performance investigation will reveal whether this option is necessary. |
Let's begin by looking at the present code in the implementation of the AvailabilityCheck interface to return combined performance and availability information. The highlighted lines use the BoxOffice EJB, which will need to perform a database query. This method is invoked several times to build information for each show. Note that the results of JNDI lookups have already been cached in infrastructure code:
 public PerformanceWithAvailability getPerformanceWithAvailability(
 Performance p) throws NoSuchPerformanceException {
 int avail = boxOffice.getFreeSeatCount(p.getId());
 PerformanceWithAvailabilityImpl (pai =
 new PerformanceWithAvailabilityImpl(p, avail);
 for (int i = 0; i < p.getPriceBands().size(); i++) {
 PriceBand pb = (PriceBand) p.getPriceBands().get(i);
 avail = boxOffice.getFreeSeatCount(p.getId(), pb.getId();
 PriceBandWithAvailability pba =
 new PriceBandWithAvailabilityImpl(pb, avail);
 pai.addPriceBand(pba);
 }
 return pai;
 }
We begin by trying the simplest possible approach: caching performance objects by key in a hash table. As this is quite simple, it's reasonable to implement it in app code, rather than introduce a third-party caching solution. Rather than worry about synchronization - potentially the toughest problem in implementing caches - we use a java.util.HashTable to hold a cache of PerformanceWithAvailability objects, keyed by integer performance ID.
| Note |
Remember that the old, pre-Java 2, collections use synchronization on nearly every method, including put and get on maps, while the newer collections, such as java.util.HashMap, leave the caller to handle any synchronization necessary. This means that the newer collections are always a better choice for read-only data. |
There's no need to set a limit on the maximum size of the cache (another problem sometimes encountered when implementing caches), as there can never be more show and performance objects than we can store in RAM. Likewise, we don't need to worry about the implications of clustering (another potential caching problem); business requirements state that data should be no older than 30 seconds, not that it must be exactly the same on all servers in any cluster. Since the business requirements state that the seat selection page, generation of which also uses the AvailabilityCheck interface, always requires up-to-date data, we need to perform a little refactoring to add a new Boolean parameter to the methods from the AvailabilityCheck interface, so that caching can be disabled if the caller chooses. Our caching logic will need to be able to check how old a cached PerformanceWithAvailability object is, so we make the PerformanceWithAvailability interface extend a simple interface, TimeStamped, which exposes the age of the object:
 package com.interface21.core;
 public interface TimeStamped {
 long getTimeStamp(); }
 }
As the period for which we cache data is likely to be critical to performance, we expose a "timeout" JavaBean property on the CachedAvailabilityCheck class, our new caching implementation of the AvailabilityCheck interface, which uses a HashTable as its internal cache:
 private Map performanceCache = new HashTable();
 private long timeout = 1000L;
 public void setTimeout (int secs) {
 this.timeout = 1000L * secs;
Now we split getPerformanceWithAvailability() into two methods, separating the acquisition of new data into the reloadPerformanceWithAvailability() method. I've highlighted the condition that determines whether or not to use any cached copy of the performance data for the requested ID. Note that the quickest checks - such as whether the timeout bean property is set to 0, meaning that caching is effectively disabled - are performed first, so that we don't need to evaluate the slowest checks, which involve getting the current system time (a relatively slow operation), unless necessary. Strictly speaking, the check as to whether the timeout property is 0 is unnecessary, as the timestamp comparison would work even if it were. However, as this check takes virtually no time its far better to run a redundant check sometimes than ever to perform an unnecessary, expensive check:
 public PerformanceWithAvailability getPerformanceWithAvailability (
 Performance p, boolean acceptCached)
 throws NoSuchPerformanceException {
 Integer key = new Integer (p.getId());
 PerformanceWithAvailability pai =
 (PerformanceWithAvailability) performanceCache.get(key);
 if (pai == null ||
 this.timeout <= OL ||
 ! acceptCached ||
 System.currentTimeMills() - pai . getTimeStamp() >this.timeout ) {
 pai = reloadPerformanceWithAvailability (p);
 this .performanceCache. put (key, pai) ;
 }
 return pai ;
}
 private PerformanceWithAvailability reloadPerformanceWithAvailability (
 Performance p) throws NoSuchPerformanceException (
 int avail = boxoffice.getFreeSeatCount(p.getId());
 PerformanceWithAvailabilityImpl pai =
 new PerformanceWithAvailabilityImpl(p. avail);
 for (int i = 0; i<p.getPriceBands() .size() ; i++) {
 PriceBand pb = (PriceBand) p.getPriceBands() .get(i);
 avail = boxoffice.getFreeSeatCount(p.getId(), pb.getId());
 PriceBandWithAvailability pba =
 new PriceBandWithAvailabilityImpl(pb, avail);
 pai.addPriceBand(pba);
 }
 return pai;
 }
Since using a synchronized hash table guarantees data integrity, we don't need to perform any synchronization ourselves. There is a possibility that, at the first highlighted line in the above listing, we will retrieve a null value from the hash table, but that before we retrieve the data and insert into the hash table, another thread will have beaten us to it. However, this won't cause any data integrity problems: the occasional unnecessary database access is a lesser evil than more complex, bug-prone code. Cleversynchronization is sometimes necessary, but it's best avoided if it doesn't deliver real value. With these changes, we set the timeout property of the availabilityCheck bean to 20 seconds in the relevant bean definition in ticket-servlet.xml and rerun the Web app Stress Tool. The result is a massive improvement in throughput and performance: 51 pages per second, against the 14 achieved without caching. The Task Manager indicates that Oracle is now doing virtually nothing. This more than satisfies our business requirements. However, the more up-to-date the data the better, so we experiment with reduced timeout settings. A timeout setting of 10 seconds produces runs averaging 49 pages per second, with an average response time well under 2 seconds, indicating that this may be worthwhile. Reducing the timeout to 1 second reduces throughput to 28 pages per second: probably too great a performance sacrifice. At this point, I was still concerned about the effect of synchronization. Would a more sophisticated approach minimize locking and produce even better results? To check this, I wrote a multi-threaded test that enabled me to test only the CachingAvailabilityCheck class, using the simple load-testing framework in the com.interface21.load package discussed earlier. The worker thread extended the AbstractTest class, and simply involved retrieving data from a random show among those loaded when the whole test suite started up:
 public class AvailabilityCheckTest extends AbstractTest {
 private AvailabilityFixture fixture;
 public void setFixture (Object fixture) {
 this.fixture = (AvailabilityFixture) fixture;
 }
 protected void runPass(int i) throws Exception {
 Show s = (Show) fixture.shows.get(randomIndex(fixture.shows.size()));
 fixture.availabilityCheck.getShowWithAvailability(s, true);
 }
}
It's essential that each thread invoke the same AvailabilityCheck object, so we create a "fixture" class shared by all instances. This creates and exposes a CachingAvailabilityCheck object. Note that in the listing below I've exposed a public final instance variable. This isn't usually a good idea, as it's not JavaBean-friendly and means that we can't add intelligence in a getter method, but it's acceptable in a quick test case. The AvailabilityFixture class exposes three bean properties that enable tests to be parameterized: timeout, which directly sets the timeout of the CachingAvailabilityCheck being tested, and minDelay and maxDelay(discussed below):
 public class AvailabilityFixture {
 public final CachingAvailabilityCheck availabilityCheck;
 public final List shows = new LinkedList();
 private long timeout;
 private JdbcCalendar calendar = null;
 private long minDelay;
 private long maxDelay;
 public AvailabilityFixture() throws Exception {
 calendar = new JdbcCalendar (new TestDataSource());
 calendar .afterPropertiesSet();
 shows. add(calendar.getShow(1));
 availabilityCheck = new CachingAvailabilityCheck();
 availabilityCheck.setCalendar(calendar);
 availabilityCheck.setBoxOffice(new DummyBoxOffice());
 }
 public void setTimeout (int timeout) {
 availabilityCheck. setTimeout (timeout);
 }
 public void setMinDelay(long minDelay) {
 this.minDelay = minDelay;
 }
 public void setMaxDelay(long maxDelay) {
 this.maxDelay = maxDelay;
 }
We're interested in the performance of the caching algorithm, not the underlying database access, so I use a simple dummy implementation of the BoxOffice interface in an inner class (again, interface-based design proves handy during testing). This always returns the same data (we're not interested in the values, just how long it takes to retrieve them), delaying for a random number of milliseconds between the value of the minDelay and maxDelay bean property. Those methods that are irrelevant to the test simply throw an UnsupportedOperationException. This is better than returning null, as we'll immediately see if these methods ever do unexpectedly get invoked:
 private class DummyBoxOffice implements BoxOffice {
 public Reservation allocateSeats(ReservationRequest request)
 throws NotEnoughSeatsException,
 NoSuchPerformanceException,
 InvalidSeatingRequestException {
 throw new UnsupportedOperationException("DummyBoxOffice.allocateSeats");
 }
 public Booking confirmReservation(PurchaseRequest purchase)
 throws ExpiredReservationTakenException,
 CreditCardAuthorizationException,
 InvalidSeatingRequestException,
 BoxOfficeInternalException {
 throw new UnsupportedOperationException(
 "DummyBoxOffice.confirmReservation");
 }
 public int getFreeSeatCount(int performanceId, int seatTypeId)
 throws NoSuchPerformanceException {
 AbstractTest.simulateDelay(minDelay, maxDelay);
 return 10;
 }
 public int getFreeSeatCount(int performanceId)
 throws NoSuchPerformanceException {
 AbstractTest.simulateDelay(minDelay, maxDelay);
 return 30;
 }
 public int getSeatCount(int performanceId)
 throws NoSuchPerformanceException {
 return 200;
 }
 }
 }
To use the real, EJB, implementation of the BoxOffice, we'd need to run the tests in the EJB container or access the EJB through a remote interface, which would distort the test results. If we weren't using EJB, we could simply read the XML bean definitions in ticket-servlet.xml in our test suite. The complexity that any use of EJB adds throughout the software lifecycle should be considered before choosing to use EJB; in this case using EJB does deliver real value through declarative transaction management, so we can accept greater complexity in other areas. We can configure our test suite with the following properties file, which is similar to the example we saw above:
 suite.class=com.interface21.load.BeanFactoryTestSuite
 suite.name=Availability check
 suite.reportIntervalSeconds=1
 suite.longReports=false
 suite.doubleFormat=###.#
 suite.reportFile=<local path to report file>
The crucial framework test suite definitions are of the number of threads to run concurrently, the number of test passes to be run by each thread, and the maximum pause value per thread:
 suite.threads=50
 suite.passes=40
 suite.maxPause=23
We set the fixture object as a bean property of the framework's generic BeanFactoryTestSuite:
suite.fixture(ref)=fixture
The fixture is also a bean, so we can configure the CachingAvailability object's timeout, and the delays in the JDBC simulation methods as follows:
 fixture.class=com.interface21.load.AvailabilityFixture
 fixture.timeout=10
 fixture.minDelay=60
 fixture.maxDelay=120
Finally, we set the properties of each worker thread:
 availabilityTest.class=com.interface21.load.AvailabilityCheckTest
 availabilityTest.(singleton)=false
First I set fixture.timeout property to 0 to disable caching. This produced throughput of about 140 hits per second, with an average response time of about 360 milliseconds. Setting the thread timeout to 1 second produced a dramatic improvement, without about 7,000 hits per second and an average response time of 7 milliseconds. Increasing the timeout further produced an improvement of 20% or less. No surprises so far. However I was a little surprised by the results of investigating the effect of synchronization. I began by replacing the Hashtable with the unsynchronized java.util.HashMap. Unless this produced a substantial improvement, there was no point in putting more effort into developing smarter synchronization. The improvement was at most 10-15% at all realistic load levels. Only by trying hundreds of users simultaneously requesting information about the same show, with an unrealistically slow database response time and a 1 second timeout - an impossible scenario, as the web interface couldn't deliver this kind of load to business objects - did the Hashtable synchronization begin to reduce throughput significantly. I learned also that eliminating the potential race condition noted above by synchronization within the getPerformanceWithAvailability() method reduced performance around 40% under moderate to heavy load, making it unattractive. With a little thought, it's easy to explain these results. Although there is an inevitable lock management load in the JVM associated with synchronization, the effect of synchronization on throughput will ultimately depend on how long it takes to execute the synchronized operations. As hash table get and put operations take very little time, the effect of synchronization is fairly small (this is quite like the Copy-On-Write approach we discussed in : synchronization is applied only to updating a reference, not to looking up the new data). Thus the simplest approach - the cache shown above, uses the synchronized Java.util.Hashtable-produced performance far exceeding the business requirements. Finally, I ran JProbe again on the same use case, with caching enabled, to see what had changed. Note that this is a profile of a single request, and so doesn't reflect synchronization costs in concurrent access:

This indicates that 94% of the execution time is now spent rendering the JSP. Only by switching to a more performant view technology might we appreciably improve performance. Further changes to Java app code will produce no benefit. Normally, such results - indicating that we've run into a limit of the underlying J2EE technologies - are very encouraging. However, it would be worth checking the JSP to establish that it's efficient. In this case, it's trivial, so there's no scope for improvement. It's time to stop. We've exceeded our performance goals, and further effort will produce no worthwhile return.
| Important |
This case study indicates the value of an empirically based approach to performance tuning, and how doing "the simplest thing that could possibly work" can be valuable in performance tuning. As we had coded the web-tier controller to use a business interface, not a concrete class, as part of our overall design strategy, it was easy to substitute a caching implementation. |
With an empirical approach using the Web app Stress tool, we established that, in this case, the simplest caching strategy - ensuring data integrity through synchronization - performed better under all conditions except improbably high load than more sophisticated locking strategies. We also established that there was no problem in ensuring that data displayed was no older than 10 seconds, more than satisfying business requirements on freshness of data. Using JProbe, we were able to confirm that the performance of the final version, with caching in place, was limited by the work of rendering the JSP view, indicating no further scope for performance improvements.
Of course the simplest approach may not always deliver adequate performance. However, this example shows that it's wise to expend greater effort reluctantly, and only when it is proven to be necessary.
|
|