Frequency and Pitch
Sound windows in GoldWave show sound as a waveform of amplitudes on a time axis. However, sound can be viewed in an entirely different way by examining its frequency and pitch content or frequency spectrum. Sounds are broken down into a combination of simple fundamental (sinusoidal) tones, each with a different frequency. This is useful for examining bass and treble levels or for isolating and studying certain sounds.
Frequency Ranges
Average human hearing spans a frequency range from about 20Hz to about 17000Hz. The figure below shows some common sounds and the frequency range they cover. Figure: Frequency Range of Sounds
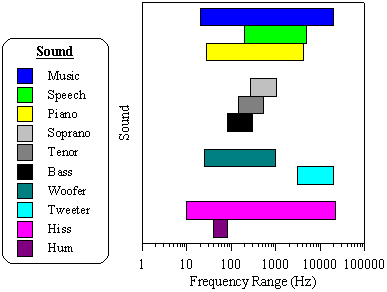
Many people wonder why it is difficult to remove vocals from music. From the figure, you'll see there is a large overlap in the frequency range of speech and music. Removing the vocals would also remove a significant part of the music. A similar problem occurs when removing hiss noise, since it often covers the entire spectrum.
Most basic stereo systems have bass and treble controls, which offer limited control over a frequency spectrum. Bass applies to low frequency sounds, such as drums, cellos, low piano notes, or a hum noise. Treble applies to high frequency sounds, such as a clash of cymbals, a tweet of a small bird, high notes on a piano, or a hiss noise.
More expensive stereo systems have Graphic Equalizers, which provide better control over a frequency spectrum. Instead of controlling just two bands (bass and treble), you can control many bands.
GoldWave provides even more control over frequency spectrums with filter effects such as Parametric EQ, Low/Highpass, Bandpass/stop, Equalizer, Noise Reduction, and Spectrum Filter.
Frequency Range and Sampling Rate
The frequency range of a digital sound is limited by its sampling rate. In other words, a sound sampled at 8000Hz cannot record frequencies above 8000Hz. In fact, the sound cannot even have frequencies above 4000Hz. According to the sampling theorem, the maximum frequency is limited to half the sampling rate. Any higher frequencies will be aliased, to lower ones, causing noise if appropriate filters are not used.
CD audio is designed to cover the full range of human hearing, which has a maximum of under 22kHz. In order to successfully record this range, the sampling theorem states that a sampling rate of at least twice the maximum must be used, so a rate of at least 44kHz is required. The actual rate is 44100Hz for standard CD players.
Frequency Spectrum Graphs
Several of GoldWave's Control visuals convert sounds into a range of frequency bands using a radix-2 fast Fourier transform (FFT) algorithm. When the results are drawn using colours, the graph is referred to as a spectrogram. When the results are drawn with lines, it is often referred to as a frequency spectrum or frequency analysis.
Frequency analysis graphs are displayed in the Noise Reduction, Spectrum Filter, and Parametric EQ filter effects. These help you to locate frequencies that you want to remove or enhance.
GoldWave applies a windowing function to the data before performing the FFT (see Control Visual Properties section). This reduces "discontinuity" errors that occur when dividing data into small chunks. A Kaiser window is used by default.
To make the spectrum more realistic to human hearing, magnitudes are scaled logarithmically. This means that if one frequency "sounds" twice as loud as another, it is graphed with twice the height (or the corresponding colour for the spectrogram).