Microsoft Windows
Apart from the basic text-based tools such as netstat, Microsoft doesn't really include many useful utilities with the consumer versions of Windows. But if you are using Windows, you have more options. The netmon tool is included with the server versions. A brief description of how this tool can be used to capture traffic was included in "Packet Capture". netmon can also be used to capture basic traffic information. Figure 8-9 shows netmon's basic capture screen. The upper-left pane shows five basic graphs for real-time traffic -- network utilization, frames per second, bytes per second, broadcasts per second, and multicasts per second. The second pane on the left lists current connections between this and other hosts. The details of these connections are provided in the bottom pane. The pane on the right gives overall network statistics. To use netmon in this fashion, just start the program and select Capture Start. In standalone mode, netmon functions as a point-monitoring tool, but as noted in "Packet Capture", it can be used with agents to collect traffic throughout the network.
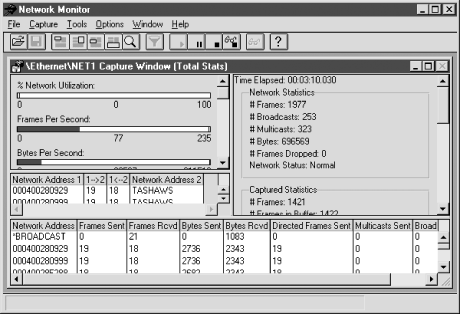
Figure 8-9. netmon traffic monitoring
For general systems monitoring, perfmon (Performance Monitor) is a better choice. It is also supplied with both the workstation and server versions. perfmon is a general performance-monitoring tool, not just a network-monitoring tool. You can use it to measure system performance (including CPU utilization) and I/O performance, as well as basic network performance. If appropriately configured, it will also monitor remote machines. Data collected is organized by object type, e.g., groups of counters. For example, with the UDP object, there are counters for the number of datagrams sent per second, datagrams received per second, datagrams received errors, etc. For network monitoring, the most interesting objects include ICMP, IP, Network Interface, RAS Ports, RAS Total, TCP, and UDP. perfmon provides four views -- alert, chart, log, and report. With alert view you can set a threshold and be notified when a counter exceeds or drops below it. Chart view gives a real-time graph for selected counters. You can customize the sampling rate and scale. Log view logs all the counters for an object to a file periodically. Finally, report view displays numerical values in a window for selected counters. Each view is independent of the others. Figure 8-10 shows the process of adding a monitored object to the chart view for the Windows version.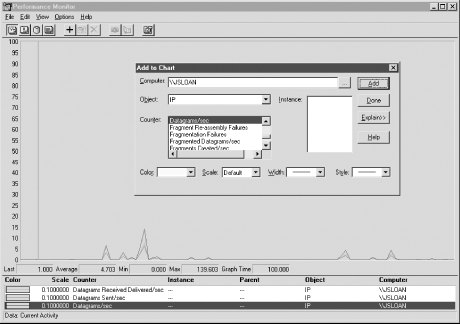
Figure 8-10. Windows perfmon
The Windows version has received a slight face-lift but seems to be the same basic program. perfmon can be particularly useful if you aren't sure whether you have a host problem or a network problem. Both netmon and perfmon are described in the Windows help files as well as several tutorials described in Appendix B, "Resources and References".ntop, mrtg, and cricket on Windows
All three major packages described in this chapter -- ntop, mrtg, and cricket -- are available for Windows systems. The developers of ntop have provided you with two choices. You can compile it yourself for free. Both the Unix and Windows versions share the same source tree. Or, if you can't easily compile it, you can buy a precompiled binary directly from them. Since ntop is basically a point-monitoring tool, you'll likely want to run it on multiple machines if you have a switched network or multiple subnetworks. Since mrtg and cricket are primarily written in Perl, it is not surprising that they will run under Windows. You'll find mrtg fairly straightforward to set up. While cricket is said to work, at the time this was written there were no published directions on how to set it up, and the Unix directions don't generalize well. Setting up mrtg for Windows is not that different from setting it up under Unix. To get mrtg running, you'll need to download a copy of mrtg with the binary for rateup. This was included with the copy of mrtg I downloaded, but the mrtg web page for NT has a separate link should you need it. You will need a copy of Perl along with anything else you may need to get Perl running. The mrtg site has links to the Active Perl site. Installing Active Perl requires an updated version of the Windows Installer, available at their site. You'll need to provide some mechanism for running mrtg on a regular basis. The file fiveminute.zip provided a program to add mrtg to the Windows scheduler. Finally, you'll want to provide some mechanism to view the output from mrtg. This could be a web server or, at a minimum, a web browser. Once you have unpacked everything, you'll need to edit the mrtg script so that NT rather than Unix is the operating system. This amounts to commenting out the fourth line of the script and uncommenting the fifth:#$main::OS = 'UNIX'; $main::OS = 'NT';
Also, make sure rateup is in the same directory as mrtg. Creating the configuration file and running the script is basically the same as with the Unix version. You'll want to run cfgmaker and indexmaker. And, as with the Unix version, you'll need to edit the configuration file to set WorkDir :. You will need to invoke Perl explicitly and use explicit paths with these scripts. For example, here are the commands to run indexmaker and mrtg on my system:
D:\mrtg\run>perl d:\mrtg\run\indexmaker d:\mrtg\run\mrtg.cfg > d:\apache\htdocs\mrtg D:\mrtg\run>perl d:\mrtg\run\mrtg d:\mrtg\run\mrtg.cfg
On my system, D:\mrtg\run is the directory where mrtg is installed and D:\apache\htdocs\mrtg is where the output is put so it can be accessed by the web server. Finally, you'll need to make some provision to run mrtg periodically. As noted, you can use supplied code to add it to the scheduler. Alternately, you can edit the configuration file to have it run as a daemon. For example, you could add the following to your configuration file:
RunAsDaemon: yes Interval: 5
You'll want to add mrtg to the startup group so that it will be run automatically each time the system is rebooted.
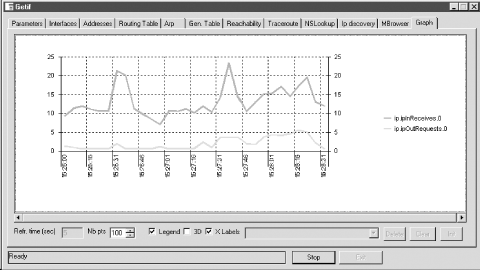
getif revisited
In "Device Monitoring with SNMP", we introduced getif but did not discuss the graph tab. Basically, the graph tab provides for two types of graphs -- graphs of ping round-trip delays and graphs of SNMP objects. The latter allows us to use getif as a traffic-monitoring tool. Graphing SNMP objects is a three-step process. First, you'll need to go back to the Parameters tab and identify the remote system and set its SNMP community strings. Next, you'll need to visit the MBrowser tab and select the objects you want to graph. Locate the objects of interest by working your way down the MIB tree in the large pane on the upper left of the window. Visit the object by clicking the Walk button. The object and its value should be added to the large lower pane. Finally, select the item from the large pane and click on the Add to Graph button. (Both of these tabs were described in "Device Monitoring with SNMP".) You can now go to the Graph tab. Each of the selected variables should have been added to the legend to the right of the chart. You can begin collecting data by clicking on the Start button. Figure 8-11 shows one such graph.